June saw a broadly positive performance across equity markets, with most global indices rising as risk sentiment improved. This came despite escalating geopolitical tensions in the Middle East. US equities in the form of the tech-heavy NASDAQ index were the top performers, rising by 4.6% in pound terms, while the UK was a notable laggard, with the FTSE 100 posting negative returns of -0.13%, reflecting domestic macroeconomic and political concerns.
Silver prices surged nearly 9.5% during the month, beginning to catch up with gold’s performance which has been setting a series of new all-time highs over the past year. This pattern is typical in the early stages of a precious metals bull market and may continue if the trend persists:

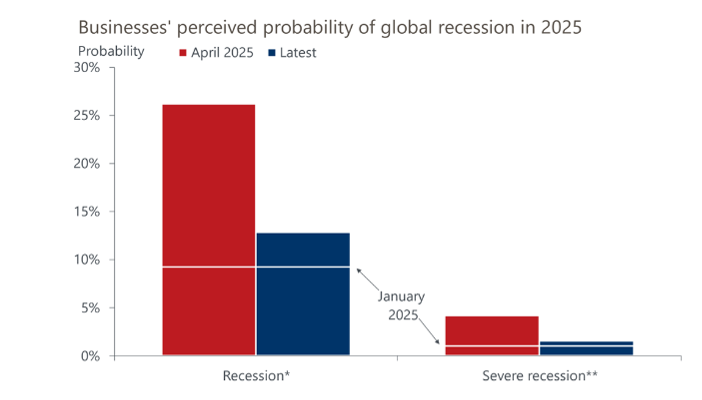
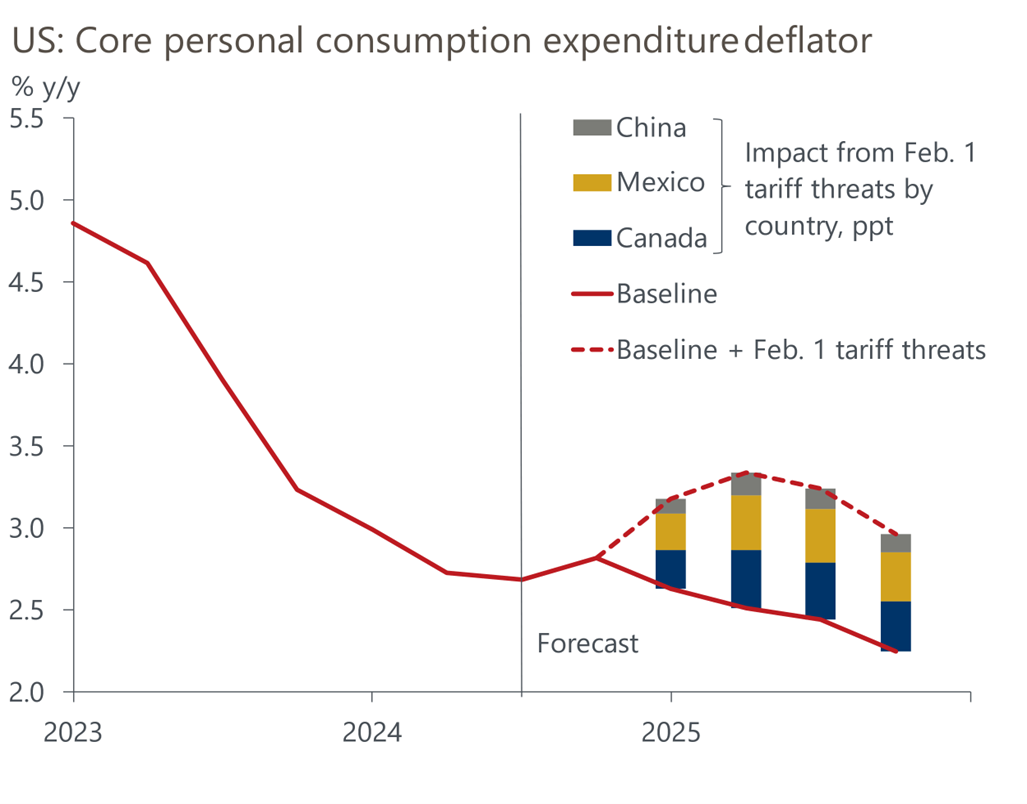
This improved sentiment followed the delay in US tariff implementation, with President Trump signaling a willingness to negotiate. This helped reduce perceived recession risks among global corporates, although growth expectations still remain well below levels seen earlier in the year:
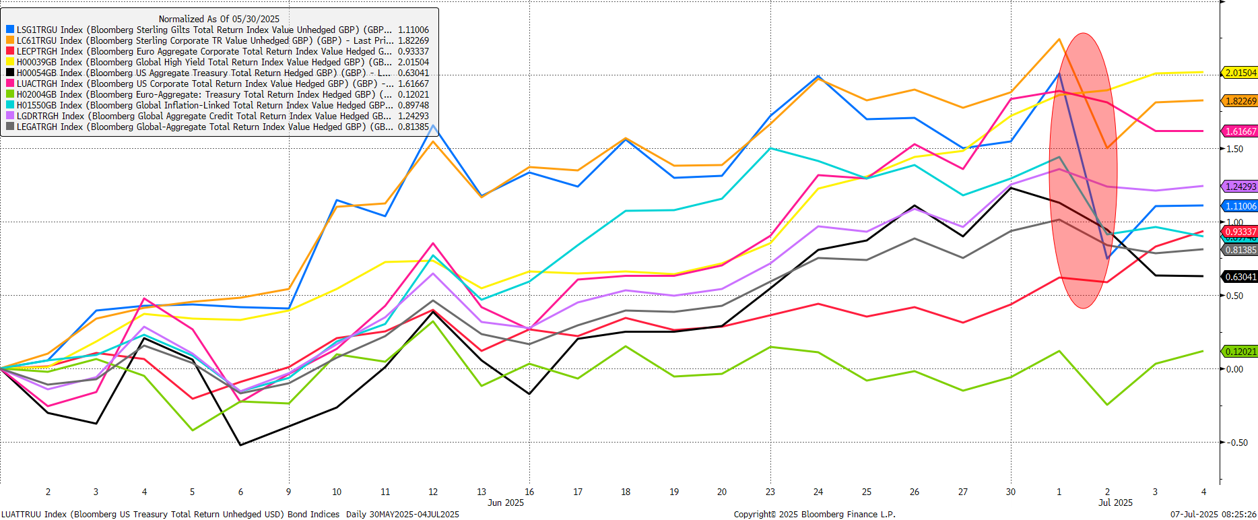
Bond markets were volatile. Sterling assets performed well during June as falling gilt yields (and therefore higher prices) reflected weaker macroeconomic data. However, a sharp drop in gilt prices occurred early in July following a session of Prime Minister’s Questions in which the Chancellor’s job security was questioned, serving to highlight the fragility of UK asset prices to political developments.
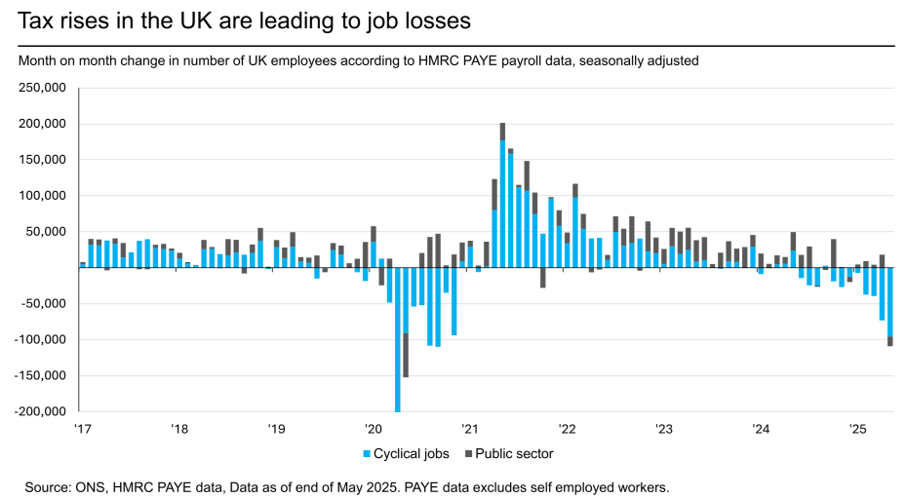
UK jobs data weakened further, with continued losses in cyclical sectors and high candidate availability reported by recruiters. This, combined with fiscal pressures, suggests the UK government may need to tighten policy by £20–30bn in the autumn budget, likely through further tax hikes and threshold freezes.
This places the government in a Catch-22 position; bond markets are expected to react negatively to any perceived fiscal loosening, but equity markets will likely react negatively to further fiscal tightening as animal spirits are crushed:
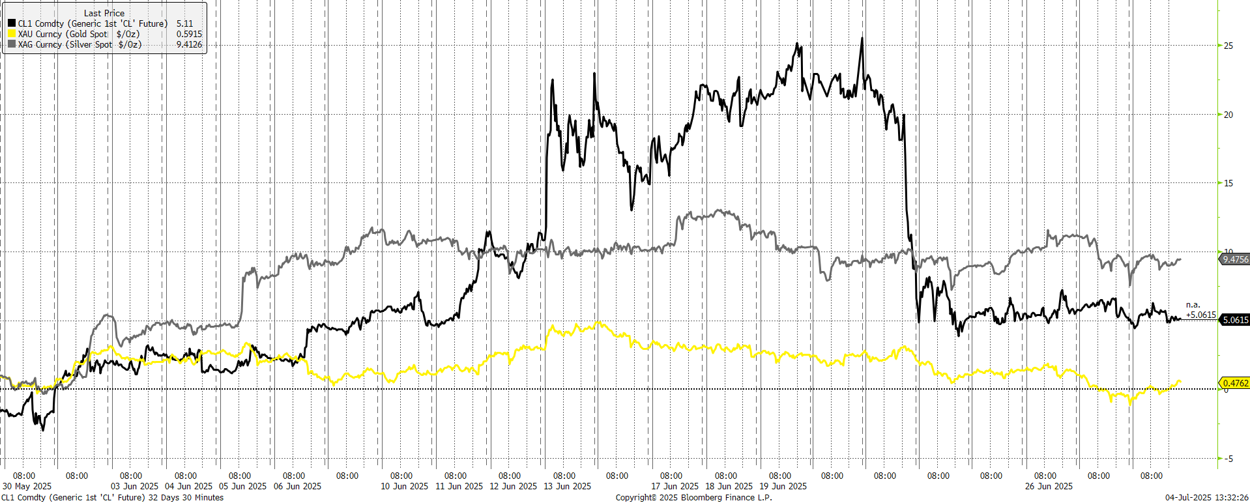
Geopolitical tensions escalated mid-month with Israel’s Operation Rising Lion and subsequent Iranian retaliation. The US intervened with Operation Midnight Hammer, but a ceasefire was reached within 12 days. Oil and gold prices spiked initially, but markets quickly stabilised, reflecting investor resilience to short-term geopolitical shocks.
Brent crude rose to nearly $80 per barrel during the conflict, driven by fears of supply disruption in the Strait of Hormuz. Although prices eased after the ceasefire, they remain elevated, reflecting a persistent geopolitical risk premium:
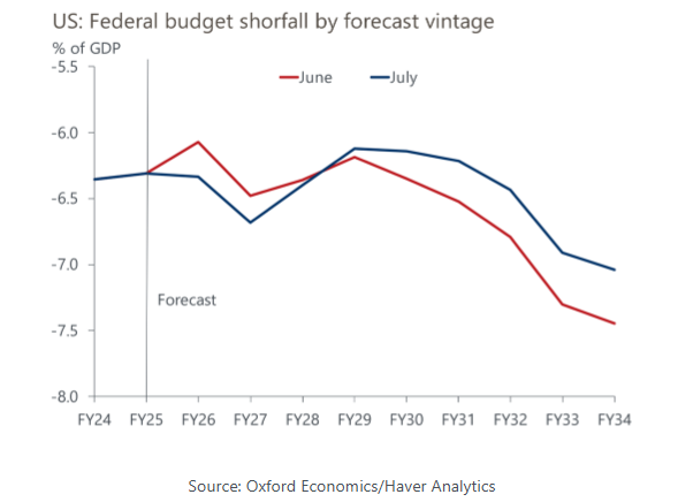
The US passed the One Big Beautiful Bill (OBBB), a major tax-and-spending package that will significantly widen the fiscal deficit. The deficit is expected to reach nearly 7% of GDP over the next few years, raising concerns about long-term fiscal sustainability. This has reinforced our preference for shorter-duration bonds:
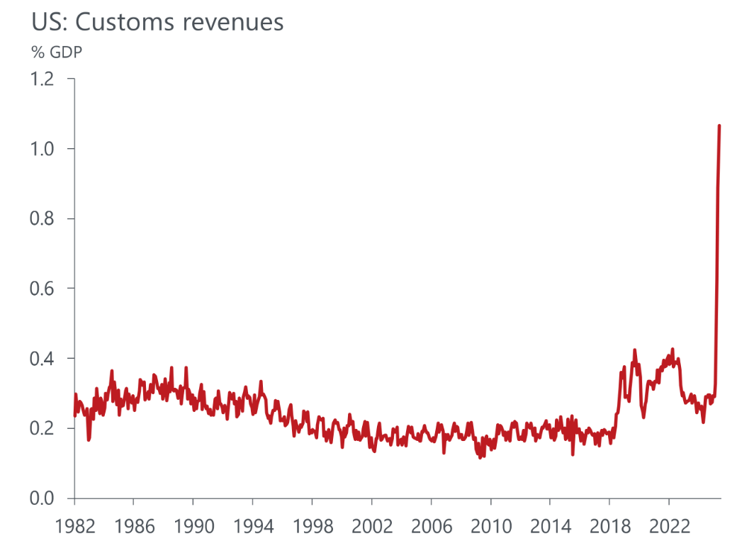
Tariff policy remains a key macroeconomic variable. The 10% universal tariff and other measures are expected to raise $2.5 trillion in revenue over the next decade. Given the president’s broad authority over trade policy, further changes could occur rapidly and without congressional approval. Retaliatory measures from other countries remain a risk, particularly in the form of non-tariff barriers.
In summary, June was marked by strong equity performance, volatile bond markets, and significant geopolitical and fiscal developments. Diversification remains essential in navigating these complex dynamics and mitigating risks associated with market volatility and economic uncertainty.
We have over 1250 local advisers & staff specialising in investment advice all the way through to retirement planning. Provide some basic details through our quick and easy to use online tool, and we’ll provide you with the perfect match.
Alternatively, sign up to our newsletter to stay up to date with our latest news and expert insights.
| Match me to an adviser | Our advisers |
The value of investments may fluctuate in price or value and you may get back less than the amount originally invested. Past performance is not a guide to the future. The views expressed in this publication represent those of the author and do not constitute financial advice.
May was marked by significant market movements and a continued complex macroeconomic and geopolitical landscape. Equity markets experienced a notable rally, driven by a temporary pause in US-China tariffs and a US court ruling that initially blocked most of Trump’s global tariffs. This led to substantial gains in US equities, with the S&P 500 futures up 5% and the Nasdaq 100 up 8.7% in GBP terms.

Strong earnings reports from major tech companies, particularly Nvidia, further boosted investor confidence in the tech sector, contributing to the overall market gains. However, the temporary trade truce also impacted other asset classes, with precious metals like gold and silver experiencing relative weakness as investors shifted their focus to equities and other riskier assets.
The FTSE 250 index also performed well, rising by 6.5% over the month, benefiting from strong earnings reports, positive economic data, reduced trade tensions, and positive sector performance in technology and consumer goods. The Bank of England’s decision to cut the Bank Rate by 0.25% to 4.25% also positively impacted market sentiment, further supporting the index’s performance.
In the UK more generally, macroeconomic data has been relatively strong, with GDP growth surprising to the upside and retail sales remaining robust. The Bank of England has continued to cut rates and has upgraded its growth forecasts for the year. The UK government announced trade deals with India and the US, which, while not game-changing for growth, are positive developments in an increasingly fragmented global trade landscape. However, there is scepticism among economists about the true level of underlying economic strength, with concerns about inflation surprising to the upside, increased government borrowing, and the potential for fiscal policy to tighten again in October’s budget.
In global currency markets, the pound strengthened versus most major currencies, driven by positive economic data, while the US dollar index initially rose before selling off again during the month, despite positive market sentiment following the US-China trade truce.

The bond market saw a reversal of last month’s moves as risk appetite returned, with riskier credit outperforming safer government bonds. Inflation surprises to the upside and continued upward pressure placed on yields by investors, who are pricing in a medium-term outlook of higher inflation driven by overly loose fiscal policy, also influenced bond market movements.

US treasuries suffered a credit rating downgrade from Moody’s, and UK gilts fell in value despite the Bank of England’s rate cut. Longer-dated bond yields, particularly the 30-year tenor, moved significantly higher over the month, reflecting market concerns over growth and inflation outlooks. The US 30-year Treasury yield hovered near 5%, similar to the UK and Germany, highlighting the caution required in fixed income allocations.

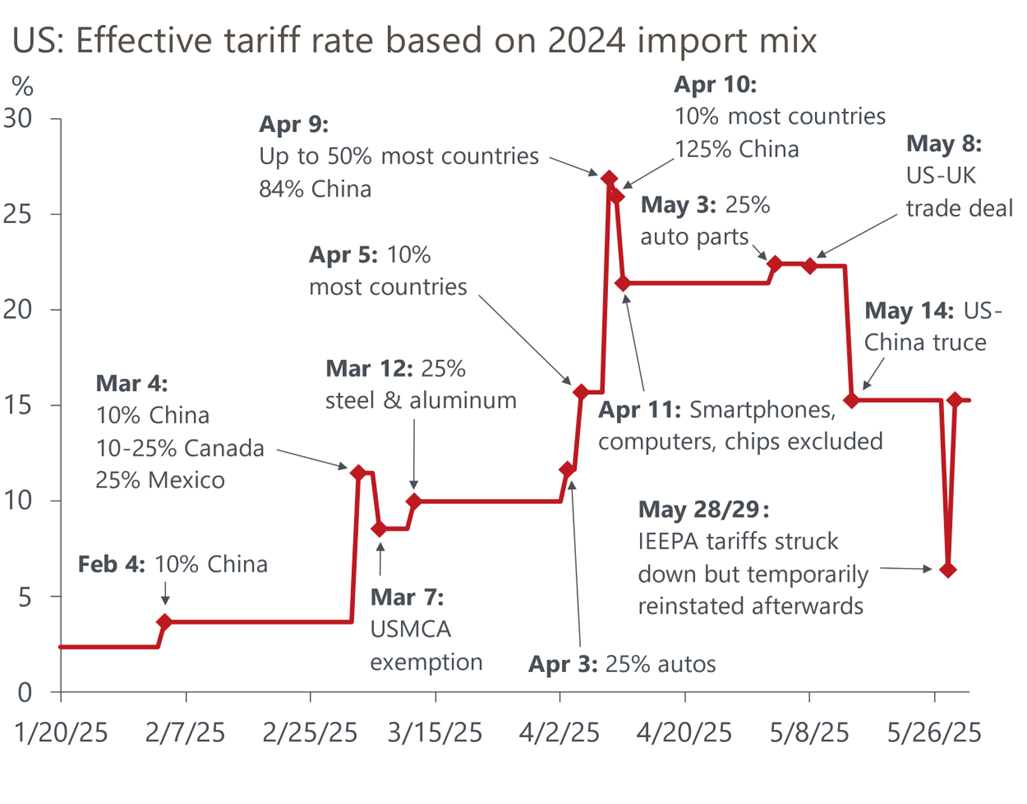
The US tariff policy continues to be a major driver of global financial market sentiment and returns. The 90-day pause for most tariffs between the US and China brought the overall effective US tariff rate down to 15%, from the previous 21-22% level. However, the outlook remains extremely uncertain, with both sides accusing each other of not adhering to the agreed terms. This uncertainty has led to increased market volatility, with investors closely monitoring any developments in the trade negotiations.
Overall, the financial markets remain highly sensitive to developments in US trade policy, economic data, and geopolitical machinations, and we remain intensely focused on developments here as we expected volatility to remain elevated across asset classes.
As always, portfolio diversification will be crucial in mitigating risks associated with market fluctuations and economic instability. By adopting a strategic approach that emphasises diversification, we can help to guide you through these uncertain times and ensure that investment portfolios are well-positioned for long-term success.
We have over 1250 local advisers & staff specialising in investment advice all the way through to retirement planning. Provide some basic details through our quick and easy to use online tool, and we’ll provide you with the perfect match.
Alternatively, sign up to our newsletter to stay up to date with our latest news and expert insights.
| Match me to an adviser | Our advisers |
The value of investments may fluctuate in price or value and you may get back less than the amount originally invested. Past performance is not a guide to the future. The views expressed in this publication represent those of the author and do not constitute financial advice.
April 2025 was a month marked by significant volatility and uncertainty across global financial markets. The primary driver of this turbulence was the announcement of sweeping tariffs by the US administration, which had far-reaching implications for trade, economic growth, and investor sentiment.
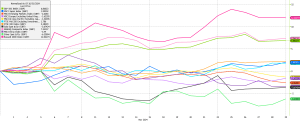
Global equity markets experienced substantial swings throughout April. The initial tariff announcements on April 2nd triggered a global sell-off, with US stocks plunging by over 10% at one point and a surge in the VIX volatility index. However, markets calmed later in the month after some US policy moderation and better-than-feared corporate earnings results. The S&P 500 ultimately closed down around 4% in GBP terms, while the tech-heavy NASDAQ outperformed despite starting the month weakly, falling by 2.5%. Ex-US developed markets outperformed strongly as capital flowed towards the UK, Europe, and Japan, continuing the trend of the previous three months. China, seen as the nation worst affected by US policy, was the weakest in GBP terms:

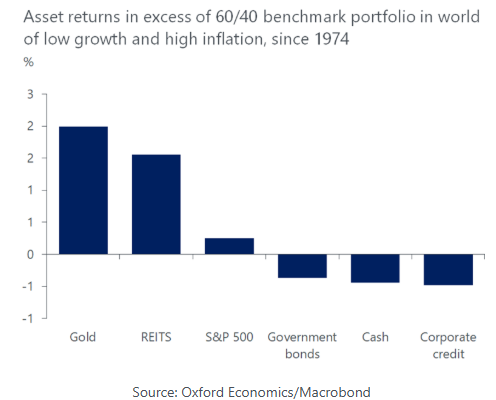
Gold performed exceptionally well in April, rising by more than 5% in GBP terms (black line above). Gold’s role as a safe-haven asset was reinforced by broader economic uncertainties and geopolitical tensions, with investors continuing to turn to the precious metal as a hedge against potential market downturns and inflationary pressures. The chart below shows the performance of various asset classes relative to a standard 60/40 equity/bond portfolio during periods of low growth and high inflation since 1974, and clearly illustrates that gold has consistently outperformed other asset classes in those periods, achieving the highest positive returns. In contrast, assets like the S&P 500 and government bonds have struggled, often showing negative or minimal returns.
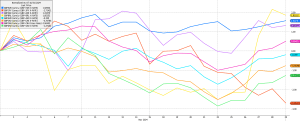
Currency markets were also strongly impacted by the tariff announcements, with movements here being a key component of equity returns when translated back into GBP. The US dollar, which would usually be expected to appreciate in an uncertain macroeconomic environment, sold off heavily vs all major currencies; the black line below charts the performance of the dollar index (DXY) which is a trade weighted index of developed market currencies vs the USD. Over April this gauge fell by 7.%, with notable underlying drops vs the Euro and Yen.

Global government bond markets saw initial rallies into the teeth of April’s uncertainty, followed by a concerted sell-off as investors priced in additional inflation concerns linked to the impact of US tariff policies. Some recovery was seen later in the month as policy moderated, but per the chart below, investment grade and high yield corporate debt underperformed government bonds over the month, while US assets underperformed European and UK counterparts. Despite signs of growth weakening in the US, the Federal Reserve has been clear that they won’t cut rates until the weakness is apparent in macroeconomic data due to inflation risks. This means less positivity at the margin for US bonds:

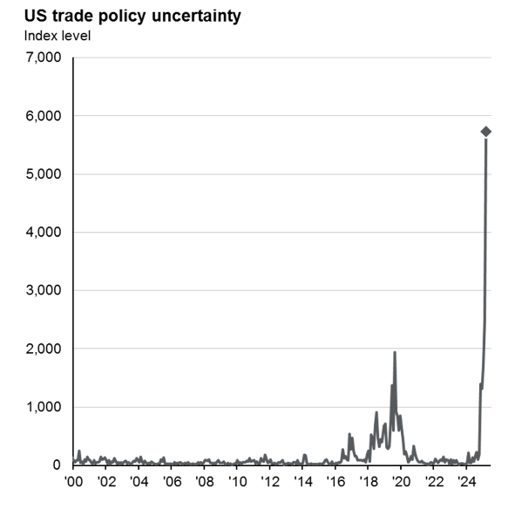
As mentioned above, one of the key themes in April was the impact of US tariff measures on the global economy. Observed levels of US trade policy uncertainty were extremely high as the chart below shows, and this uncertainty is expected to persist into the third quarter of 2025, adding to concerns about a potential growth slowdown, especially as the full shock from tariffs hasn’t fully hit macroeconomic and earnings data yet:
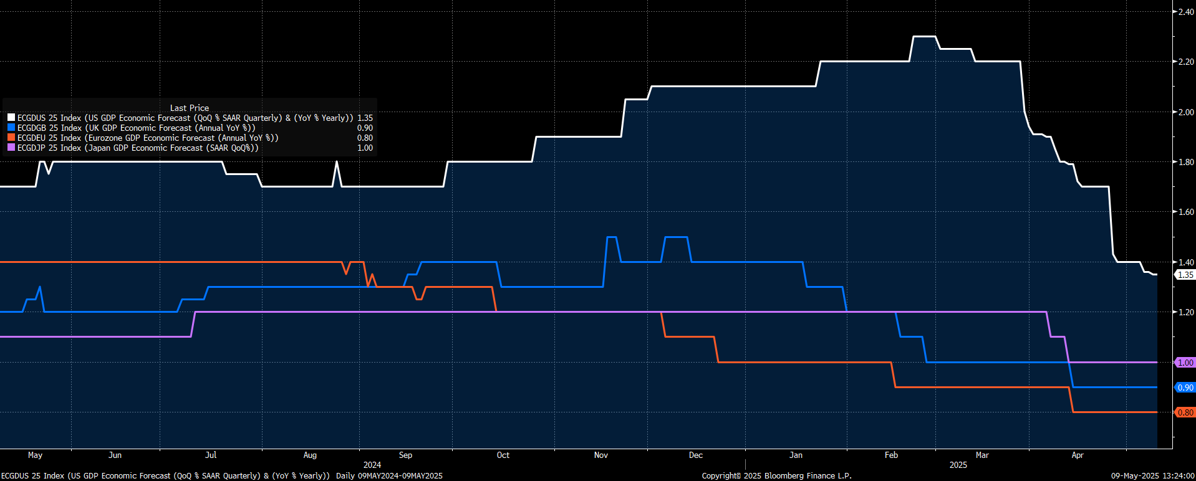
Economic indicators such as GDP growth and inflation trends have shown mixed signals. The final chart below shows market consensus 2025 GDP forecasts for the US (white), UK (blue), Eurozone (orange) and Japan (pink), with all to a greater or lesser extent having been downgraded since the start of the year. The US GDP growth forecast has suffered particularly heavily, falling from a relatively robust peak of c.2.3% in February 2025 down to 1.35% today, with the trajectory still downwards. This decline underscores the challenges faced by the US economy and others in maintaining growth momentum amidst external pressures.
Looking ahead, financial markets’ drivers are expected to remain complex and dynamic, with several key factors shaping the investment landscape; most prominently the ongoing impact of US tariffs will continue to influence global trade policies, creating uncertainty and potential volatility. Additionally, central bank actions, including policy adjustments and rate cuts, will have significant implications for various asset classes. Understanding the direction of monetary policy will be important to adjust strategies accordingly.
As always, portfolio diversification will be crucial in mitigating risks associated with market fluctuations and economic instability. By adopting a strategic approach that emphasises diversification, we can help to guide you through these uncertain times and ensure that investment portfolios are well-positioned for long-term success.
We have over 1250 local advisers & staff specialising in investment advice all the way through to retirement planning. Provide some basic details through our quick and easy to use online tool, and we’ll provide you with the perfect match.
Alternatively, sign up to our newsletter to stay up to date with our latest news and expert insights.
| Match me to an adviser | Our advisers |
The value of investments may fluctuate in price or value and you may get back less than the amount originally invested. Past performance is not a guide to the future. The views expressed in this publication represent those of the author and do not constitute financial advice.
March 2025 brought significant volatility across global markets, shaped by intensifying trade tensions, divergent central bank policies, and mounting recession concerns. Investor sentiment deteriorated as the US administration dramatically expanded tariffs targeting multiple trading partners, while fiscal developments in Europe and the UK highlighted contrasting approaches to economic challenges. The combination of increasing protectionism, sticky inflation, and slowing growth created a complex environment for investors navigating an increasingly uncertain global landscape.
Equities faced the brunt of the growing uncertainty around global trade and economic growth. major indices such as the S&P 500 extended their February correction, losing 8% in March, heavily impacted by technology and cyclical sectors reacting to escalating tariff threats and policy uncertainty. European equities also weakened, with the MSCI Europe index declining by -3.2%, driven by sluggish regional growth and heightened US trade tensions. Germany’s substantial fiscal stimulus announcement later in the month provided partial relief, particularly benefiting defence and infrastructure-related stocks.
In the UK, the FTSE All Share fell -2.6%, though larger-cap stocks provided relative resilience due to exposure in banks, defence, and commodities. Japanese equities fell by -3.6%, while broader Asian sentiment was mixed. Notably, Chinese equities held up well, losing only -0.5% despite ongoing trade concerns.

Bond markets saw volatility throughout March but held up relatively well, helped by a rally across most major indices in the final week. US government bonds gained 0.2%, as recession fears drove Treasury yields lower in a flight to safety and a repricing of Federal Reserve rate cuts this year. In Europe, bonds reacted negatively to Germany’s announced, “fiscal bazooka,” pushing Bund yields sharply higher towards 3%, and causing European government bonds to lose -1.7%. UK gilts also declined, by -1.2%, despite the Bank of England’s cautious easing stance.
Despite broader market volatility, corporate bonds displayed notable resilience, highlighting selective investor confidence in credit quality amidst macroeconomic uncertainties.

Currency markets reflected the broader themes playing out across economies in March. The US dollar weakened against all major currencies, as investors reassessed the demand for US assets given trade uncertainty and a weaker economy leading to more rate cuts. The Pound also weakened against the Euro, given the comments made above about how European Central Bank rates might also stay higher, alongside a stronger German economy at the heart of the region.
Trade policy dominated economic discussions in March, with the US administration aggressively expanding its tariff regime. Having already implemented tariffs against China, Canada, and Mexico in February, President Trump ordered a 25% tariff on autos and auto parts on March 26, effective April 3.
Initial tariffs announced on March 4 were somewhat watered down after negotiations, but tariff rates on US imports from Canada and Mexico have still ended up at double-digit levels. The market currently assumes 25% tariffs will be reimposed in April on imports from Canada and Mexico (with a lower 10% tariff on Canadian energy) alongside the steel, aluminium and China tariff.
Taken together, the overall US effective tariff rate is expected to significantly rise from its previous level – a dramatic shift that reverses several decades of trade globalisation. Markets are now bracing for further potential escalation, with additional “reciprocal tariffs” expected to be announced in early April, following what Trump describes as the United States’ “Liberation Day” on the 2nd. Investor concerns extend beyond the blunt tariffs currently being enforced or threatened, particularly given the ongoing uncertainty surrounding their exact nature, with plans appearing to shift almost daily. This volatile environment makes it extremely difficult for businesses and consumers to plan effectively, leading to delays in capital expenditure, hiring, investment, and broader spending. Such hesitation may result in knock-on effects further down the line.
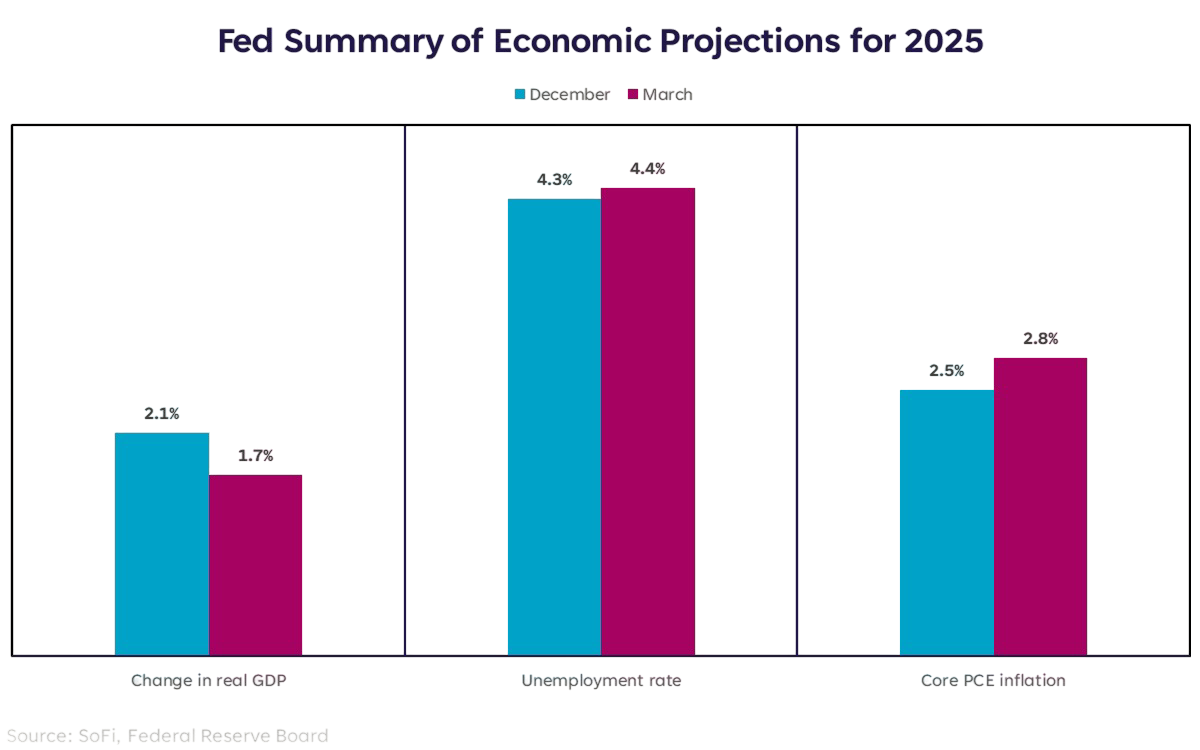
All this uncertainty is already beginning to weigh on business and consumer confidence, as well as broader economic projections. In the Federal Reserve’s March meeting, they updated their projections for the end of 2025, shown below, lowering growth, while rising the rate of inflation and unemployment. However, it is important to note that these levels are still far from forecasting a recession and independent from political noise would be considered healthy.
March brought a paradigm shift in European fiscal policy, centred on Germany’s massive stimulus announcement. The incoming CDU-SPD coalition government proposed an unprecedented fiscal expansion that quickly earned the nickname “fiscal bazooka”. The package totals approximately €500 billion (12% of 2024 GDP) and represents a dramatic departure from Germany’s traditional fiscal conservatism.
The plan includes widening the structural deficit allowed under Germany’s constitutional debt brake, exempting defence spending above 1% of GDP from deficit calculations, and creating a massive infrastructure fund outside the scope of the debt brake. This would fund a substantial increase in defence spending from just 1.3% of GDP in 2021 to around 3% by 2027, alongside accelerated €100 billion investment in transport, energy, and digital infrastructure.
This fiscal expansion is deemed significant enough to transform Germany’s economic outlook. Economists have substantially revised their projections upward, now expecting GDP growth to average 1.8% over the next four years – 0.7 percentage points higher than forecast just a month ago. However, this fiscal expansion also raises inflation concerns for the region.
The UK Spring Statement, delivered on March 26th, revealed a challenging economic outlook and limited fiscal flexibility. The Office for Budget Responsibility cut its 2025 GDP forecast to 1.0% (from 2%), though it projected improvement from 2026 onward with growth of 1.9% in 2026, 1.8% in 2027, 1.7% in 2028, and 1.8% in 2029.
Inflation is expected to follow a complex path – having fallen to 2.8% in February (the lowest since the inflation surge began), it’s projected to rise again to 3.8% by July before averaging 3.2% overall for 2025. The forecast then shows inflation falling to 2.1% in 2026 and reaching the Bank of England’s 2% target in 2027.
Chancellor Rachel Reeves announced approximately £10 billion in fiscal tightening to address a £14 billion deterioration in public finances since the October Budget. Despite this adjustment, fiscal headroom remains limited at just £9.9 billion – leaving little margin for error if economic conditions deteriorate further. Reeves also announced several spending priorities, such as defence expenditures and building social and affordable housing.
The global market and economic environment we find ourselves in presents a complex mix of challenges and opportunities. Escalating trade tensions, persistent inflation concerns, and mounting recession fears create headwinds, yet selective opportunities exist across asset classes for investors.
The key to navigating this uncertain landscape lies in diversification, across geographies, asset classes, sectors, and investment styles. By maintaining a balanced approach, focusing on quality, and remaining tactically flexible, investors can position portfolios to weather potential volatility while capturing opportunities as they emerge.
We have over 1250 local advisers & staff specialising in investment advice all the way through to retirement planning. Provide some basic details through our quick and easy to use online tool, and we’ll provide you with the perfect match.
Alternatively, sign up to our newsletter to stay up to date with our latest news and expert insights.
| Match me to an adviser | Our advisers |
The value of investments may fluctuate in price or value and you may get back less than the amount originally invested. Past performance is not a guide to the future. The views expressed in this publication represent those of the author and do not constitute financial advice.
February was another month of shifting dynamics in global markets, shaped by a mix of trade tensions, geopolitical uncertainty, and evolving policy expectations. Investor sentiment remained cautious as fresh U.S. tariffs targeted China, Canada, and Mexico, while diplomatic and political developments added to the complexity of the broader macroeconomic landscape.
Equity markets navigated these uncertainties with resilience in some cases, though performance varied by region. In the UK, stocks edged higher, supported by a more stable currency environment and strength in defensive sectors like consumer staples and utilities. Large-cap stocks outperformed their smaller counterparts as investors continued to favour established companies with strong balance sheets in a period of uncertainty. Across the Atlantic, U.S. markets carried their post-election momentum forward, though small caps struggled here too as concerns around tariffs and trade-sensitive sectors took hold.
Elsewhere, Chinese equities were by far the strongest performers over the month, driven higher by improved sentiment following more government pronouncements of support, and positivity following last month’s Deepseek announcement:

The bond market had its share of volatility, with government yields rising early in the month before stabilising as economic data came in softer than expected. In the U.S., concerns over higher spending and potential inflation pressures initially pushed yields higher, but by the latter half of February, those fears eased somewhat. Meanwhile, European bonds held firm, as investors sought safety amid political uncertainty in Germany, where the incumbent government was swept aside in elections. Credit markets remained relatively calm, with investment-grade corporate bonds attracting demand.

Currency markets reflected the broader themes playing out across economies. The U.S. dollar weakened as global trade risks grew, driven by President Trump’s wayward policy announcements. Sterling appreciated against most major currencies as GDP data surprised to the upside. The one currency it didn’t strengthen against was the Japanese yen in (-1.6%) as we saw hawkish comments from the Bank of Japan around interest rate rises, some very strong consumer spending & wages data, and some risk aversion coming back into market, for which the yen is a classic haven.

Trade remained a major point of focus, with the U.S. administration pushing forward with its plans to increase tariffs. A new 10% levy on Chinese imports, effective from early March, added to supply chain concerns, while additional tariffs on industrial metals are set to follow later in the month. Canada and Mexico were also hit with fresh trade restrictions, and there is growing speculation that European exports may soon face similar treatment. Investors will be watching closely to see if these measures escalate into broader retaliatory actions, particularly from China and the EU.
Beyond trade, geopolitical tensions showed no signs of easing. The Russia-Ukraine peace talks stalled, and with the risk of the U.S. withdrawing some level of support, uncertainty around the region deepened. In Europe, Germany’s elections reshaped the political landscape, and while coalition negotiations are ongoing, early signals point to a shift toward higher government spending and more pragmatic economic policies. Markets have so far reacted cautiously, waiting for further clarity.
Against this backdrop, as always, avoiding knee-jerk reactions to short-term market noise remains critical, and our portfolio positioning remains focused on stability, and long-term resilience through diversification.
We have over 1250 local advisers & staff specialising in investment advice all the way through to retirement planning. Provide some basic details through our quick and easy to use online tool, and we’ll provide you with the perfect match.
Alternatively, sign up to our newsletter to stay up to date with our latest news and expert insights.
| Match me to an adviser | Our advisers |
The value of investments may fluctuate in price or value and you may get back less than the amount originally invested. Past performance is not a guide to the future. The views expressed in this publication represent those of the author and do not constitute financial advice.
Global equity markets started the year on a positive note, recovering from the headwinds experienced towards the end of 2024. European equities rebounded sharply, posting gains of over 8% in January, following a challenging December driven by concerns around tariffs and weakness in key sectors. The FTSE 100 was another standout performer, rising nearly 6% and reaching an all-time high, marking its best monthly performance since November 2022.
Despite ending well, U.S. equities exhibited significant volatility, particularly in the final week of January, driven by a combination of earnings reports from major technology firms and a significant market shakeup caused by DeepSeek’s Artificial Intelligence (AI) breakthrough. The S&P 500 and Nasdaq saw substantial swings, reflecting the uncertainty around AI-related investments and potential disruptions to the current semiconductor landscape.
Emerging Markets and Asian equities underperformed relative to developed markets, despite exhibiting lower volatility levels. The FTSE 250 also struggled to keep pace with the broader market rally, highlighting continued economic uncertainty in the UK’s mid-cap space.

Bonds had a steadier and more positive month compared to late 2024, with corporate bonds outperforming government bonds. High-yield bonds led the way, reflecting continued investor appetite for risk in a more stable market environment.
Inflation-linked bonds also performed well, supported by concerns over inflation persistence, particularly in the U.S., where upcoming policy decisions and geopolitical risks weighed on sentiment. Market expectations for rate cuts in 2025 have moderated, with fewer cuts now priced in compared to earlier forecasts, leading to upward pressure on bond yields across major developed markets.
Notably, European government bonds were the weakest performer in the bond space, reflecting ongoing economic stagnation and political uncertainty. The European Central Bank (ECB) moved to cut rates to 2.75%, as expected, with markets anticipating similar action from the Bank of England in their February meeting. In contrast, the Federal Reserve opted to hold rates steady, reinforcing expectations of a “higher-for-longer” stance on U.S. interest rates.

The British Pound had a weak month, declining against most major currencies. This was primarily driven by weaker-than-expected economic growth in the UK and a shift in market expectations toward further interest rate cuts by the Bank of England, compared to just a few months ago. Meanwhile, the US dollar strengthened against most currencies, particularly in the latter part of the month, as the implementation of Trump’s proposed trade tariffs began in the final week.
A major event impacting markets in January was the unexpected impact of DeepSeek, a Chinese AI company that launched a highly competitive AI model at, reportedly, a fraction of the cost of its Western counterparts. This triggered widespread concern among investors regarding the sustainability of the heavy capital investments made by major technology firms in AI infrastructure.
The revelation that DeepSeek had trained its model using older and cheaper semiconductor chips sent shockwaves through the semiconductor sector, with Nvidia, in particular, losing nearly $600 billion in market capitalisation in a single session. To put the size of this move into context, only 14 listed companies in the world have a market capitalisation higher than the amount that Nvidia lost.
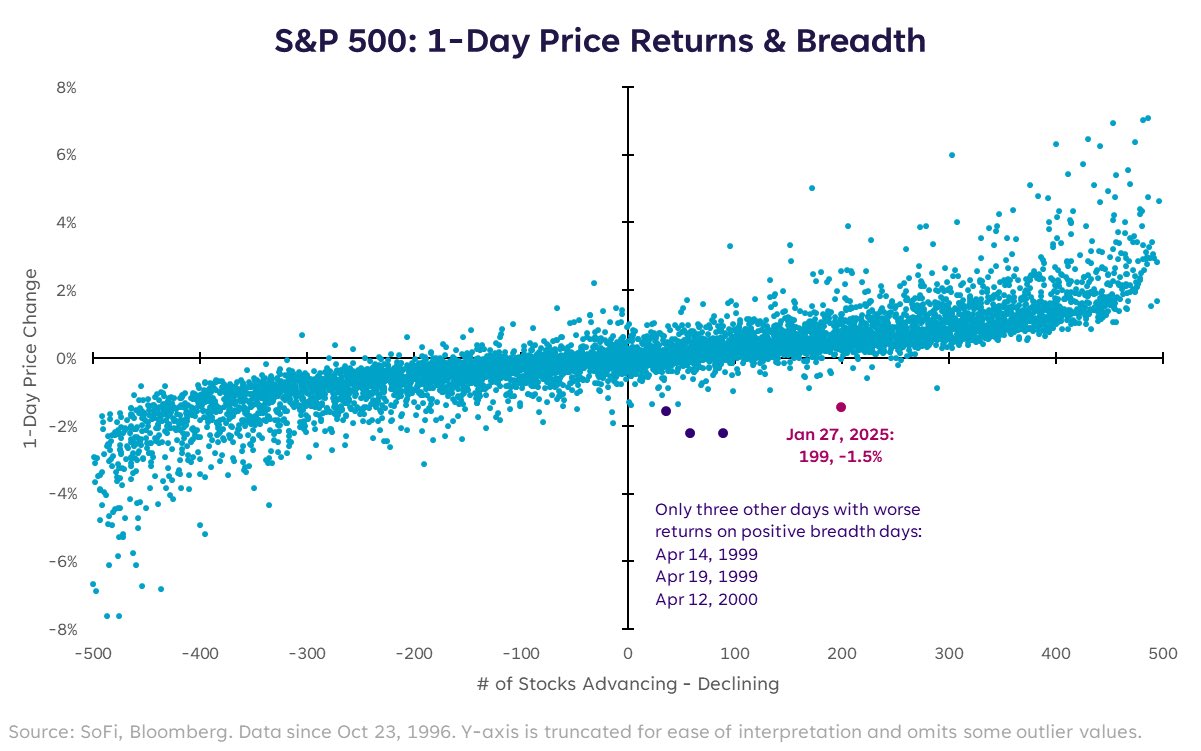
Despite this disruption, broader equity markets demonstrated resilience, with around 300 S&P 500 stocks remaining flat or positive despite the index’s overall decline, as shown in the chart below. This supports the view that equity market leadership is gradually broadening beyond the “Magnificent 7” tech stocks, a trend that may continue through 2025.
January also marked the beginning of President Trump’s second term, bringing with it immediate policy shifts that impacted market sentiment. His administration moved swiftly to implement tariffs, initially suggesting a postponement on Mexico and Canada before abruptly reversing course and imposing 25% tariffs on both nations. Additionally, a 10% tariff was levied on Chinese goods, with the possibility of further increases in the future.
These tariff measures have raised concerns over inflation, as the cost of imported goods will rise and consumers may feel the brunt of these increases. Early estimates suggest that tariffs on Canada and Mexico will have a more significant inflationary impact than those on China, given the changing trade flows since Trump’s first term.
There was, however, a large disparity between those rates cuts that were made and those that had been priced into markets as we came into 2024, which as the year progressed led to elevated levels of market volatility, and in the U.K., caused the Gilt Index to post another year of losses, closing down -3.0%.
Other major bond indices fared slightly better, with falling interest rates and continued economic resilience proving particularly constructive for credit markets, with the Global Aggregate Credit Index eking out an annual return of 3.6%. It was the Global High Yield Index that again gave bond investors the greatest returns though, adding 10.7% and exhibiting low levels of volatility through periods of changing interest rate expectations.
Alongside tariffs, stricter immigration controls were introduced, further tightening an already constrained U.S. labour market. With unemployment at historically low levels, these policies risk exacerbating labour shortages, which could drive wage inflation higher and impact the broader economy. Bond markets have already reacted to these developments, with yields rising in anticipation of prolonged inflationary pressures.
The unpredictability of Trump’s policies, particularly in trade and labour markets, has introduced a new layer of volatility to financial markets. Investors will need to remain adaptable as more clarity emerges on the administration’s long-term economic strategy.
January provided investors with a stark reminder of the importance of diversification and caution in navigating an increasingly complex global economic landscape. While equity markets started the year strong, volatility remains a key theme, particularly in the technology sector.
The bond market’s response to shifting inflation expectations and central bank policy decisions will continue to be a focal point, as investors weigh the impact of higher-for-longer interest rates against slowing global economic growth. Additionally, geopolitical risks, trade policy shifts, and evolving AI investment dynamics will be key factors influencing market direction in the coming months.
As we move further into 2025, maintaining a well-diversified approach and adapting to changing market conditions will be essential for investors seeking to manage risk while capitalising on the available opportunities.
We have over 1250 local advisers & staff specialising in investment advice all the way through to retirement planning. Provide some basic details through our quick and easy to use online tool, and we’ll provide you with the perfect match.
Alternatively, sign up to our newsletter to stay up to date with our latest news and expert insights.
| Match me to an adviser | Our advisers |
The value of investments may fluctuate in price or value and you may get back less than the amount originally invested. Past performance is not a guide to the future. The views expressed in this publication represent those of the author and do not constitute financial advice.
Bond and equity markets fell through December, with the MSCI ACWI closing the month down -1.7%, in sterling terms, while the Bloomberg Global Aggregate Bond Index fell -0.9%, driven by an upward repricing of bond yields.
Although December’s Federal Reserve meeting saw Chairman Powell meet market expectations and deliver a 0.25% cut to the US policy rate, the central bank’s supporting narrative shifted, with projections for 2025 moving to reflect just two further cuts through the year, in contrast to the four that were hinted at previously. From a market perspective, this shift towards a higher-for-longer U.S. interest rates scenario puts pay to the perfect backdrop of strong growth plus rate cuts that had been helping support prices through prior months, ultimately leading to losses across both bonds and equities.
From a macroeconomic perspective, however, the U.S. economy remains in good shape. Consumer spending is forecast to be on track for 3% annualised growth in Q4, while healthy consumer balance sheets and strong wage growth continue to provide support. Across the corporate sector, manufacturing activity beat expectations through December, increasing to its highest level since March – a positive sign as we move into the new year.

Elsewhere, Chinese equities offered a ray of holiday cheer to markets, with the MSCI China index closing the month up 2.7%, in GBP. Despite mounting deflationary pressures across the region and ongoing weakness in economic activity, broadening conviction that 2025 will bring interest rate cuts and significant further stimulus helped bolster Chinese equities through the year end.
In local currency terms, Japanese equities also performed well, gaining 2.8%, as policy normalisation and a moderate resurgence of inflation continued to support the region’s growth outlook and boost broad sentiment. However, for U.K. investors, an appreciation of sterling versus the yen weighed heavily on translated returns, with the MSCI Japan index falling -1.3% in GBP.
Closer to home, following a 0.3% increase in CPI inflation to 2.6%, the Bank of England (BoE) opted to hold U.K. rates at 4.75% at their December meeting, with officials stating the bank will maintain its “gradual approach” to cuts as we move through 2025 – a move that caused the aforementioned strength in sterling. While the BoE’s action, or lack thereof, was largely priced into markets, it did not stop U.K. government bonds selling off as we progressed through the month, with the U.K. Gilt index ending December down -2.7%.

Losses were also felt across other major global bond indices, with government bonds generally underperforming their corporate counterparts, as changing interest rate expectations pushed up yields. Once again, it was the Global High Yield Index that outperformed, benefitting from an element of spread compression as well as its shorter duration and lower sensitivity to nominal interest rate movements.
Looking back at 2024 as a whole, although markets were disappointed with the level of cuts that were made in some regions, developed market central banks were clear in their intention to begin bringing down policy rates, as illustrated in the chart below.
There was, however, a large disparity between those rates cuts that were made and those that had been priced into markets as we came into 2024, which as the year progressed led to elevated levels of market volatility, and in the U.K., caused the Gilt Index to post another year of losses, closing down -3.0%.
Other major bond indices fared slightly better, with falling interest rates and continued economic resilience proving particularly constructive for credit markets, with the Global Aggregate Credit Index eking out an annual return of 3.6%. It was the Global High Yield Index that again gave bond investors the greatest returns though, adding 10.7% and exhibiting low levels of volatility through periods of changing interest rate expectations.

As we look towards 2025, bond markets undoubtedly offer good opportunity for both growth and income, but we need to look to the year with an element of caution and continue to be selective in where we allocate capital within the fixed income universe. Further cuts to policy rates will certainly help boost returns, however, should economic resilience begin to wane, or inflation surprise to the upside, we will likely see further volatility.
Within equity markets, the picture through 2024 was more positive, driven by exceptional performance from the US ‘Magnificent 7’. From an index perspective, the Nasdaq, shown below in pink, was the standout leader, closing the year up 32.0% in GBP, while the broader US S&P 500 also benefitted from the ramp up in technology valuations, gaining 25%.
While outperformance from US markets has been very well publicised, a number of other good performing areas have flown a little more under the radar. Chinese equities in particular exhibited strength through latter months of 2024, following announcements from Beijing in September that stimulus measures would be put in place to help shore up the region’s ailing property market and get its economy back on track. While equity returns from the region were choppy, low starting valuations and improving investor sentiment allowed the MSCI China Index to gain 18.6%, in GBP.
Japanese equities also performed well, with ongoing corporate reforms helping drive optimism about the economy’s shift towards growth, away from deflation and towards monetary policy normalisation. In March, this saw the Bank of Japan raise interest rates for the first time in 17 years, putting an end to the country’s historic era of negative rates. However, with subsequent hikes bringing the Japanese policy rate to just 0.25%, the yen remains deeply undervalued versus other currencies, a factor that weighed on translated equity returns through the year. In GBP, the MSCI Japan Index, in blue below, returned 9.9%.

Across the U.K., in what was hoped would trigger an economic and market revival, the summer election provided equities with a small mid-year boost of optimism – a feeling that was swiftly reversed following the autumn budget. With higher corporate taxes and higher government spending now expected to put pressure on private sector growth and create stickier inflation, the trajectory of U.K. interest rates is less clear. Come year end, this lack of clarity contributed to the FTSE 100 returning a modest 5.8%.
European equities fared no better, as growth across the region continued to slow, while political issues mounted. German manufacturing activity, which was once the powerhouse of European growth, still sits deep within contractionary territory – under pressure from high energy costs, mounting levels of regulation and growing overseas competition. While political resolution, more stable inflation and falling interest rates should help revive the European economy as we move through 2025, it remains difficult to see any clear drivers of growth.
As we move through the new year, we see reason for optimism, as global economies begin to absorb lower interest rates. Research indicates that corporate earnings are expected to pick up across developed markets, driving GDP growth. Furthermore, where 2024 saw returns concentrated within a small subset of mega cap U.S. technology stocks, it is thought 2025 will bring a broadening in equity market returns, both within the U.S. and globally, with investors much for focused on underlying earnings growth.
But, while the overall picture speaks to positivity, markets have a tendency to surprise, and with a new president about to enter the White House, both the U.S. and wider global economy face a lot of uncertainties.
2024 once again showed us that diversification across portfolios does benefit. There is no question that U.S. technology was exceptional through the year, however it was not the only area to have surprised to the upside. Diversified investors will have seen allocations to China and Japan both add notable levels of value, while fixed income and alternative assets – global high yield, global credit and gold – also benefitted.
Looking forward, retaining this level of diversification will be key to navigating the changing economic and political backdrop, while the ability to adapt will ensure opportunities are taken, if and when they arise.
We have over 1250 local advisers & staff specialising in investment advice all the way through to retirement planning. Provide some basic details through our quick and easy to use online tool, and we’ll provide you with the perfect match.
Alternatively, sign up to our newsletter to stay up to date with our latest news and expert insights.
| Match me to an adviser | Our advisers |
The value of investments may fluctuate in price or value and you may get back less than the amount originally invested. Past performance is not a guide to the future. The views expressed in this publication represent those of the author and do not constitute financial advice.
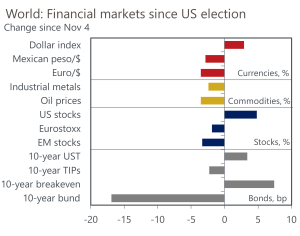
November was a month of profound shifts in financial markets and geopolitics, with the U.S. presidential election at the centre of attention. The election results, policy expectations, and macroeconomic conditions have created a ripple effect across markets, marking a pivotal moment for investors worldwide.
U.S. equities delivered stellar returns in November, with the NASDAQ and S&P 500 advancing 7.4% and 6.9%, respectively. Small-cap stocks took the lead though with an extraordinary 12% rise, signalling renewed optimism for domestic-oriented companies. The election of President Trump for a second term was a catalyst for this rally, driven by investor anticipation of pro-growth policies, including manufacturing reshoring and ambitious spending plans. U.S. markets appeared buoyed not only by immediate post-election positivity but also by the broader expectation of fiscal stimulus and deregulation under a Republican-controlled government.
Conversely, global markets outside the U.S. faced challenges. While the UK and Japan posted modest gains, Chinese and broader emerging market equities lagged significantly, reflecting both geopolitical tensions and internal policy shortcomings. In China, a $1.4 trillion fiscal package failed to inspire confidence as it lacked direct measures to stimulate domestic demand, exacerbating concerns about trade relations with the U.S. The unease around escalating tariffs and their potential global fallout weighed heavily on sentiment.
Currency movements reflected the divergence in regional fortunes. The U.S. dollar strengthened, supported by election-driven economic optimism, while the British pound experienced mixed performance, declining against the yen and dollar but gaining against the euro. Political turbulence in Europe, particularly in France and Germany, amplified the euro’s weakness. In Latin America, Brazil’s real tumbled as President Lula backtracked on fiscal discipline, introducing populist tax measures that rattled markets.
Bond markets experienced a turbulent start to the month, with yields rising amid concerns over increased government spending in the U.S. However, sentiment shifted around 22nd November as highlighted in the chart below, following the nomination of Scott Bessant as U.S. Treasury Secretary; a move that reassured markets of stable financial stewardship. European bonds outperformed, bolstered by expectations of further rate cuts in the face of weak growth and inflation.
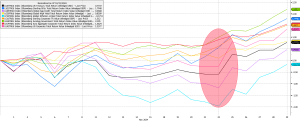
Underlying these market movements is a mix of optimism and uncertainty. The Republican sweep in the U.S. elections signals a clear path for Trump’s policy agenda, which includes substantial spending, corporate and individual tax
cuts, and an emphasis on reshoring and trade protectionism. While these measures could sustain U.S. market outperformance, they also bring risks. The spectre of widespread tariffs looms large, with potential repercussions for global trade and inflation. The lack of clarity around the administration’s trade policies has left markets on edge, particularly in regions heavily reliant on U.S. trade flows, such as Mexico and Canada.
Commodities markets have reflected these global shifts, with industrial metals pricing in deflationary pressures outside the U.S., further underscoring the divergence in economic prospects between America and the rest of the world. The broader narrative suggests a U.S.-centric growth story, but one fraught with challenges for global integration and cooperation.
Source: Oxford Economics
Looking ahead, the picture remains complex. On one hand, U.S. markets appear poised for continued strength, buoyed by fiscal stimulus and supportive policy dynamics. On the other hand, rising trade tensions and potential tariff implementations could introduce significant volatility, added to the fact that the valuations picture remains very stretched. The balance of these forces will likely define the trajectory of markets in the months ahead.
For investors, this environment underscores the importance of adaptability and diversification. While the U.S. continues to lead global growth, exposure to other regions and asset classes remains vital to navigate potential headwinds. In this context, our approach remains grounded in disciplined risk management and a focus on long-term value creation.
We have over 1250 local advisers & staff specialising in investment advice all the way through to retirement planning. Provide some basic details through our quick and easy to use online tool, and we’ll provide you with the perfect match.
Alternatively, sign up to our newsletter to stay up to date with our latest news and expert insights.
The value of investments may fluctuate in price or value and you may get back less than the amount originally invested. Past performance is not a guide to the future. The views expressed in this publication represent those of the author and do not constitute financial advice.
October was a month marked by a series of dynamic and complex developments across global financial markets, with a mix of economic data surprises and political uncertainty creating a multifaceted narrative.
In local currency terms (i.e. unadjusted for GBP fluctuations), equities performed poorly to a greater or lesser extent, with only Japan being positive. However, over the month, GBP was weaker against most major currencies, meaning when translated back to pounds, equity returns were improved, if still lacklustre:
In GBP terms, US equities delivered strong gains as the US dollar rose in value by more than 3.5% against the pound per the chart above (green line above). Underneath the surface, the US index struggled somewhat into the end of the month as big tech earnings disappointed investors; while the absolute quantum of these earnings was, as usual, very impressive, the valuation levels ascribed to them is already very high, meaning investors expect spectacular numbers very quarter, and tend to be disappointed if this is not the case:
Elsewhere, Chinese equity market (purple line above) sentiment was extremely volatile, driven by a cocktail of regulatory concerns and mixed economic data. After a very strong September and start to October, investors grappled with uncertainty as government officials failed to provide further updates around stimulus measures. Further announcements are expected in this month (November), with officials waiting for the US election result before moving forward.
The precious metals market offered some relief, as gold and silver remained in demand (bright green and black lines above). These assets continued to attract investors seeking a hedge against geopolitical, monetary and fiscal policy risks, highlighting the ongoing appeal of real assets, not just as a store of value but also as an opportunity for enhanced returns.
The bond market, meanwhile, presented one of the more puzzling stories of the month. Despite global central banks starting their rate cutting cycles, bond yields have risen over the last month. This unexpected movement reflected broader concerns about fiscal stability, and continued doubts about central banks’ effectiveness in taming inflation The situation was particularly pronounced in the UK, where the highly anticipated budget announcement at the end of the month led to a sharp spike in gilt yields and capital losses in the bond market (dark blue line below):
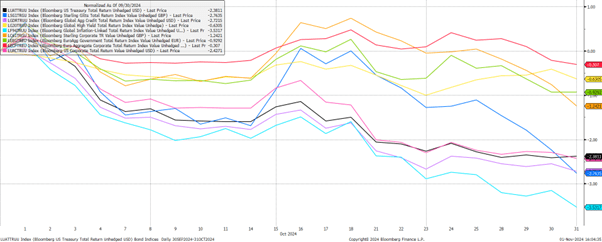
The government’s new fiscal measures, which included raising the employer National Insurance rate to 15%, adjustments to Capital Gains and Inheritance Tax, and substantial spending increases, were met with scepticism. Investors worried about the government’s ability to manage economic challenges while pursuing such expansive spending policies, resulting in the Gilt yield spike above, a weaker pound and weaker domestic equities.
The Office for Budget Responsibility (OBR) offered a grim analysis of the budget. Their assessment painted a picture of lower GDP growth, reduced labour market participation and disposable incomes, and higher inflation, which, in turn, was expected to keep bond yields and interest rates elevated. The coming weeks and months will be crucial for the government to frame their policy suite in a more positive light.
Adding to the global geopolitical complexity was the heightened focus on the upcoming US election. With polls indicating a tight race, the market is braced for various potential outcomes, each carrying significant implications. Regardless of the outcome, both political camps are expected to maintain high levels of fiscal spending, which only adds to the medium-term economic uncertainty in the United States. Volatility remained elevated over the month with every headline pored over in a frenzy by investors; we shall comment on the outcome in next month’s update.
We have over 1250 local advisers & staff specialising in investment advice all the way through to retirement planning. Provide some basic details through our quick and easy to use online tool, and we’ll provide you with the perfect match.
Alternatively, sign up to our newsletter to stay up to date with our latest news and expert insights.
| Match me to an adviser | Subscribe to receive updates |
The value of investments may fluctuate in price or value and you may get back less than the amount originally invested. Past performance is not a guide to the future. The views expressed in this publication represent those of the author and do not constitute financial advice.
September was a busy month for markets, driven by decisions made by major central banks, the Chinese Government announcing a major stimulus package, and a new Prime Minister in Japan.
Starting with interest rates, in September we had meetings from many major central banks, with rate changes being seen in Canada, the US and Europe, while rates were held in the UK and Japan. The Bank of Canada (BoC) and European Central Bank (ECB) both cut rates by 0.25%, having cut rates previously earlier in the year. The most significant cut came from the Federal Reserve, who cut rates for the first time since March 2020, opting for a cut of 0.5%.
The Bank of England however opted to hold rates at 5%, pausing from their first cut of 0.25% back in July. Andrew Bailey, Governor of the Bank of England, mentioned that the committee feel they have a good hold on inflation at the moment, but want to be careful not to cut too quickly, as many economists are noting that labour pressures are higher in the UK than many other developed markets.
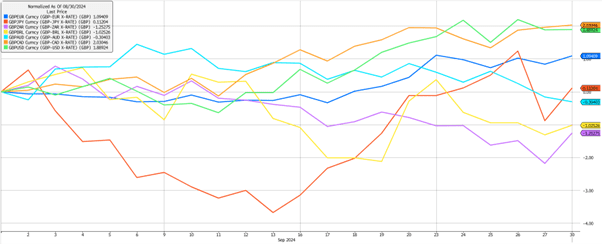
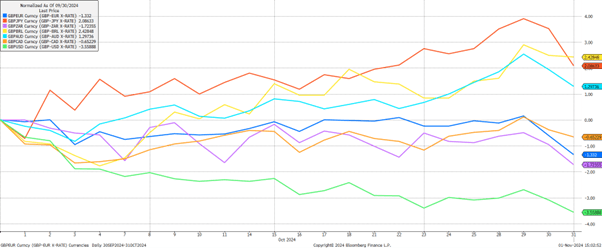
These central bank decisions led to a strong month for Sterling, gaining against most major currencies as shown in the chart above. With most significant gains against the Canadian Dollar and US Dollar of around 2%. It was another volatile month for the Japanese Yen, which gained almost 4% against Sterling during the first half of the month, before giving back all of those gains and ending weaker against Sterling. The weakness followed the Bank of Japan’s decision not to raise rates from the still very low levels of 0.25%. There was also a spike in volatility for the Yen in the last few days of the month, following the news that the Liberal Democratic Party had elected Shigeru Ishiba as the new Prime Minister.
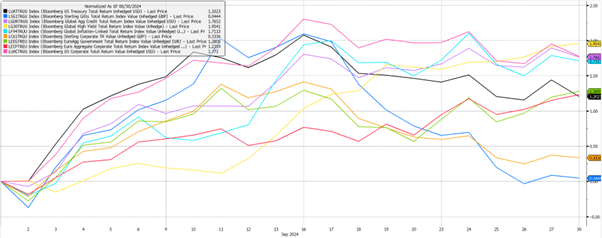
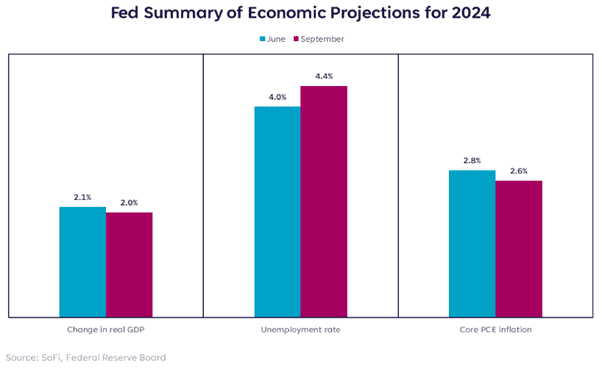
Moving over to bonds, we saw US and global indexes outperform, given the backdrop of falling interest rates and the Federal Reserve (Fed) deciding to start with the larger cut of 0.5%. Going into this meeting, the market was pricing around a 50/50 chance between a 0.25% and 0.5% cut. Fed Chair, Jerome Powell, highlighted that they opted for the larger cut as they were seeing some weakness is the economy, particularly in the labour market, while inflation was deemed more under control. The below chart helpfully explains their thinking around this, and where they think some key economic projections look like now, compared to the June meeting. You can see that real GDP is slightly down from the June prediction, while forecasts for unemployment were higher than they had expected. Then you have Core PCE, which is the Fed’s favoured inflation metric, which was lower than previous estimates.
This meant that, for now, the priority was on the health of the labour market, and while inflation remains more under control, they are willing to act more decisively around how and when they will be reducing rates.
We touched on this last month, and while it was understood that we will be seeing cuts from the Fed, the key remains what the long-term trajectory and how quickly rates will continue to be lowered compared to current market pricing. At the moment, both the Federal Reserve and market pricing is another 0.5% of rate cuts over the next two meetings before the end of the year, however things start to diverge when we look at where expectations of rates are throughout 2025.
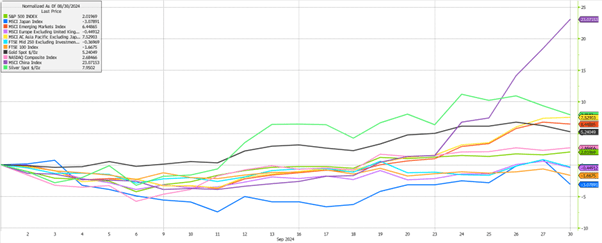
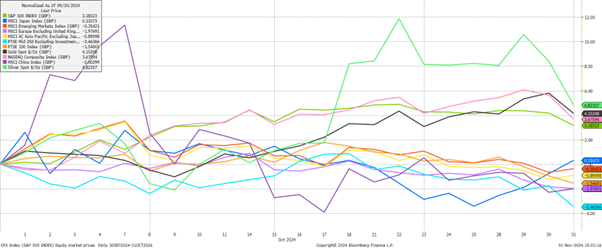
Moving on to equities, we saw quite mixed performance across the major indexes that we usually reference, and all returns in the graph above are shown in local currency. This means that the strength in Sterling we discussed earlier negatively impacted returns when translated back to GBP, particularly for equities listed in the US and to a lesser extent Europe and Asia. The significant outlier here was in Chinese equities, up 23%, as the Government announced the largest package of stimulus since 2020. The measures ranged from reducing interest and mortgage rates, to encouraging local Governments to buy unsold housing, with large capital pools provided to support the equity market and direct payments to help support lower income households.
Some of these tactics have been tried before, with little success, but the key to these measures were that they were both at a much larger scale, and combined as one package rather than done one-by-one. As well as this, the market has been calling for more serious action to be taken to support the property market which has been a major drag on economic growth and consumer sentiment in China. That market has suffered from an oversupply, causing property prices to steadily decline over the last four years. In China, around 63% of household wealth is held in property, so as prices have been going lower, that has been felt very directly by residents, impacting spending, job creation and sentiment around the equity market.
Chinese equities have long suffered as a consequence of this difficult economic backdrop, and rising concerns around geopolitics. So much so that in September, China lost its spot as the largest country weighting in MSCI Emerging Markets. Therefore at a time when interest in Chinese equities was at a trough, this stimulus package caused a significant, positive shift in sentiment, with Chinese equities seeing their best week of performance since 2008. In order for this rally to be sustained, we need to see the Government act on these pledges and on future pledges that they alluded to, and see that improve consumer confidence and flow through to corporate earnings.
This boost in Chinese equities led to Asian and wider Emerging Markets outperforming other regions, gaining 7.5% and 6.4% respectively.
September was another strong month for precious metals, with silver up 8% and gold up 5%. This was less surprising given the rate cuts we saw, particularly in the US, as environments of lower interest rates are usually more supportive for those metals.
US equities performed well on the back of rate cuts, with the technology heavy NASDAQ gaining 2.6% and the wider S&P500 not far behind with a 2% gain.
It was a less positive month for UK listed equities, given the Bank of England’s decision to hold rates steady, Sterling strength and some concerns from investors around changes that may be announced in the upcoming budget. This led to losses of -0.4% for the FTSE250, and -1.7% for the FTSE100.
Japanese equities also continued their run of being a more volatile area of developed markets, losing -3.1% over September. This market had sold off during the first half of the month as investors had expected to see the Bank of Japan raise rates, but then rallied through the second half following their decision to hold rates steady. As with the Yen, we then saw significant volatility in the last couple trading days of the month, as the market digested the news of the new Prime Minister and what that might mean for fiscal spending and interest rate policy.
Looking forward to the remainder of the year, investors are still heavily focussed on global growth and employment in the US, and what that might mean for the trajectory of interest rates. For now though, growth remains resilient and unemployment remains at low levels. We also now have the added injection of stimulus from China, which should help support their economy and in turn wider global growth.
We have over 1000 local advisers & staff specialising in investment advice all the way through to retirement planning. Provide some basic details through our quick and easy to use online tool, and we’ll provide you with the perfect match.
Alternatively, sign up to our newsletter to stay up to date with our latest news and expert insights.
| Match me to an adviser | Subscribe to receive updates |
The value of investments may fluctuate in price or value and you may get back less than the amount originally invested. Past performance is not a guide to the future. The views expressed in this publication represent those of the author and do not constitute financial advice.