
Market Updates
Oliver Stone

February saw a bifurcation between equity and bond returns, with generally positive moves for global equity markets driven by strong corporate earnings reports, while fixed income came under pressure again as economic data remained resilient and expectations for interest rate cuts were pushed further out into 2024.
The first chart below shows equity market returns in pound terms during February, with outliers to the up and downside. One positive story to immediately pull out here is that of Chinese equities (dark purple line), where we saw a gain of more than 9% during the month. Having hit a five-year low coming into February, activity data over the Luna New Year holiday period showed good strength, and this, combined with more supportive interventions from the Chinese government boosted sentiment.
Given how far the Chinese index has fallen over the last year, this barely moves the dial in terms of relative returns, and valuations remain extremely cheap, but with the news getting less bad, we see this as a positive development, and we remain optimistic on the region’s prospects.
As written about last month, the Chinese government have been steadily introducing explicit and implicit stimulus and stabilisation measures, including restrictions on securities lending for short selling, easing of real estate restrictions, greater access to credit for real estate related companies, and the possibility of sovereign bond issuance to fund national projects. China’s National People’s Congress is taking place at the time of writing, and with growth targets and strategies often announced here, we can reasonably expect support to continue to flow.

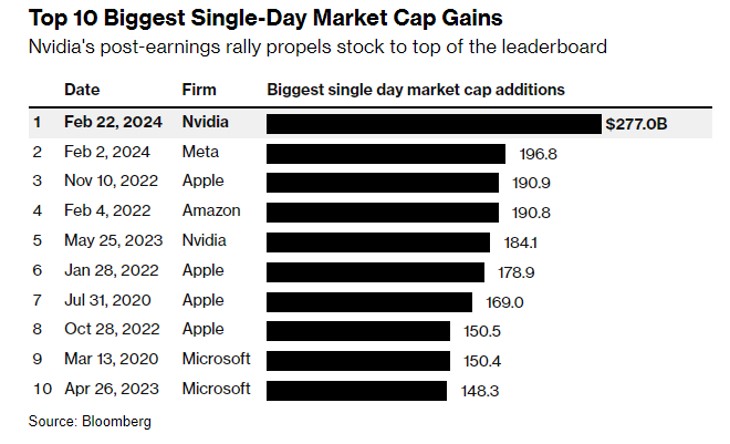
Elsewhere, somewhat inevitably, we saw strong performance from US equities broadly (green line) and from the growth and technology-focused Nasdaq index (pink line) in particular, returning 6.0% and 7.0% respectively. During the month we saw quarterly earnings results from the ‘Magnificent 7’ tech stocks, which resulted in some extraordinary performance from a couple of members of this exclusive club; Meta and Nvidia.
Meta jumped by 20% on its 2nd February results day, which was the largest one day market cap gain for any stock in history, before promptly being beaten by Nvidia a couple of weeks later which itself jumped by around 16% on its own results day, adding some $277bn of market cap in one day. To put that into context, $277bn is over $20bn more than the market cap of the entire UK listed investment trusts universe of c.$250bn, and not far off the entire FTSE 250’s market cap.
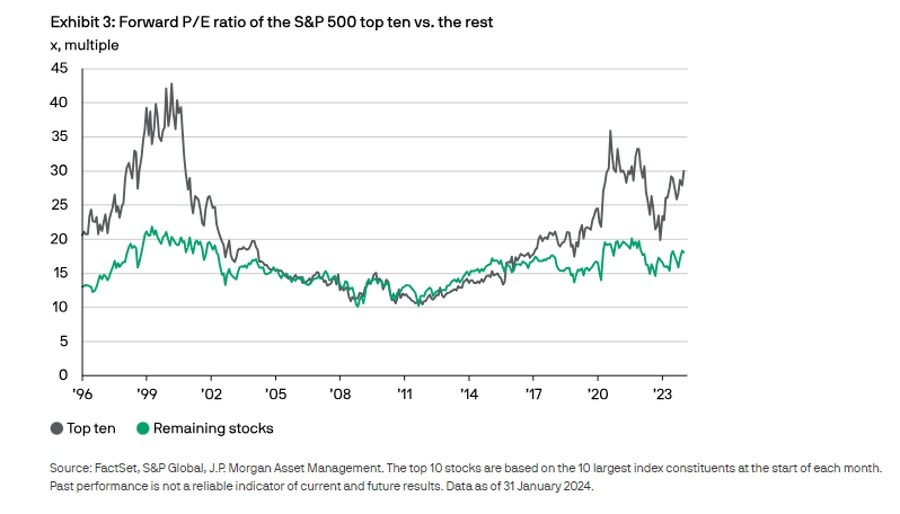
These largest technology-focused companies’ share prices have been driven by the AI narrative over the past year, but despite strong earnings reports, expectations for future growth keep moving higher. Per the chart below, the largest ten stocks in the S&P 500 are trading on a multiple of roughly 30x forward earnings, with these earnings already expected by investors to expand much faster than the rest of the index. This compares to around 18x forward earnings for the remainder of the S&P 500, where earnings expectations are more modest, but still in themselves elevated in absolute terms and relative to other regions.
Meeting these earnings expectations will in part depend on whether AI lives up to current hype. While the speed of rollout and adoption of AI is impressive, its eventual impact is hard to confidently forecast at this stage:
Finally in equities, the UK performed relatively poorly during the month following a -0.3% (quarter-on-quarter) fourth quarter GDP print that showed the UK falling into a technical recession in 2023. Despite this, we think that the fundamental and macroeconomic backdrop for the UK is positive; the labour market is strong, the housing market seems to be picking back up again, consumers have got a lot of savings they can still deploy, and important leading indicators are strong, indeed stronger than most other major nations.
In fixed income, once again high yield bonds (yellow line), which of course are much more closely linked to equities than government bonds in terms of their risk return profile, outperformed, while more traditional government and investment grade corporate bonds underperformed, as we saw signs that inflation might not be completely under control continued, and central banks started to push back on rate cut narratives given continued economic strength.

Given the recent strength in economic data, we have seen a repricing of investors’ expectations with regards interest rate cuts as the chart below shows, which was the main driver of weakness particularly in the government bond space. The chart highlights the pathway for US interest rates that investors now expect (red line) vs what was expected at the end of December 2023 (blue line), with fewer and later rate cuts now priced in.
We have over 1000 local advisers & staff specialising in investment advice all the way through to retirement planning. Provide some basic details through our quick and easy to use online tool, and we’ll provide you with the perfect match.
Alternatively, sign up to our newsletter to stay up to date with our latest news and expert insights.
| Match me to an adviser | Subscribe to receive updates |
The value of investments may fluctuate in price or value and you may get back less than the amount originally invested. Past performance is not a guide to the future. The views expressed in this publication represent those of the author and do not constitute financial advice.
For further information, please contact:
For further information, please contact:

